In this tutorial we will be optimizing the reactants, products, and the transition state of a reaction. We will learn how to prepare Gaussian 16 input files with the objective to get its potential energy surface.

DFT Calculation Workflow for Optimization
Before tackling the transition structure (TS), the first step is to optimize the geometries of reactants and products. If the reactants or products are not stable minima, then it is impossible to locate a TS that connects them.
- Build the molecules using Gaussview (or use XYZ coordinates from another source) to create an input file for Gaussian (.com file). Below is an example output file for a water molecule
%mem=8GB
%nprocshared=8
%nosave
#P METHOD/BASIS-SET opt freq=noraman

opt freq=noraman water

0  1
O          0.24600        0.20600        0.00000
H          1.20600        0.20600        0.00000
H         -0.07500        1.11100        0.00000
General considerations:
A Gaussian input file has a specific format which must be followed. Blank lines are not optional and must be there at specific positions. Actual example input files are provided below. Some options can be included to specify how the calculation will be run on the computer/cluster:
%mem=XX tells Gaussian how much memory to use
%nprocshared=XX tells Gaussian how many shared processors to employ
%nosave tells Gaussian not to save the intermediate files (checkpoint .chk, integrals .int, read-write file .rwf, etc.) if the calculation is successful. For some calculations it might be required to save some of those files and to change this option.
#P starts the route line, where you indicate the job you want to run. Aspects needed:
METHOD: The computational method (for us usually density functional) used
BASIS-SET: The basis set used
EXAMPLE: # B3LYP/6-31+G(d,p)
JOB COMMANDS: Keywords to tell Gaussian what we want to do.
For ground-state optimizations (like reagents, products, intermediates): opt freq=noraman
For TS optimization: opt=(ts,calcfc,noeigentest) freq=noraman
–opt requests a structure optimization, freq=noraman requests a frequency calculation on the optimized structure. While you can split these two calculations in two input files, we find it easier to have them together in one output for anything but the largest calculations.–
After the route line, you need a blank line, then a title line (it can be anything), then another blank line.
Then, you place the information about your structure. First, you need to specify the charge of the system (0 for neutral, -1 of monoanionic, +1 for monocationic, etc.) and the multiplicity (typically 1, for singlet). Finally, you insert the XYZ coordinates of the structure, followed by a final blank line.
- Transfer the file on your local cluster with a file transfer software (we use FileZilla).
- Submit the input file to a Gaussian calculation (how to do this varies for each cluster)
- Once the job is finished, download the output file (.log or .out) and visualize the results using Gaussview or another visualization software.
- You need to verify that the structure has no imaginary frequencies, so it can be considered a true minimum. Then, you can extract the energies, enthalpies and free energies from these output files.
Workflow for Transition State Localization
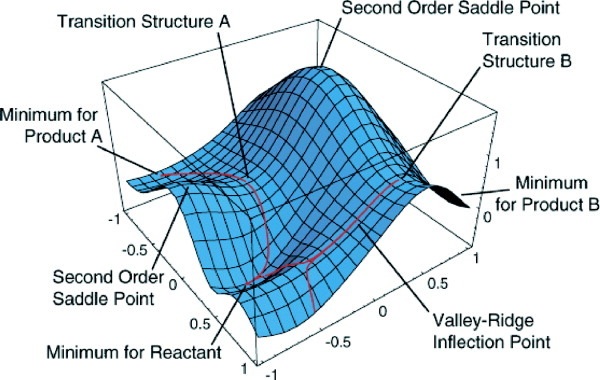
A transition state is the maximum of energy along the reaction coordinates (seen in top graph), and a minimum in all other directions (1st order saddle point) (seen in graph below). Locating such structures is both a science and an art, and various approaches are possible. Two main approaches are 1) to run a scan along the reaction coordinate in order to find a structure close to a maximum in energy or 2) to run a constrained optimization on a guess structure. Both approaches require running a constrained optimization in Gaussian.
Constrained optimizations to find transition structures:
- In order to locate the TS using a scan, you want to progressively modify the structure of a minimum connecting the TS (a reagents complex or a products complex) along the reaction coordinates and calculate the energy of each structures to find a maximum.
- If you cannot run a scan and do not have access to a good guess structure from another source, you will have to optimize a guess geometry before doing the full TS optimization.
Gaussian can optimize a structure while keeping a geometry parameter (bond length, angle, dihedral) frozen. Bond lengths/angles that are critical for the reaction coordinate (e.g. a forming or breaking bond) should be frozen so that Gaussian does not try to optimize them (i.e. make them at the length of a formed/broken bond). Alternatively, you can request Gaussian to scan along that geometry parameter that is critical to the reaction. Below is an example of a scan input file.
%mem=2GB
%nprocshared=8
%nosave
#p opt=modredundant b3lyp/6-31+g(d,p)

scan SN2 F-

-1 1
 C                  0.00000000    0.29534700    0.00000000
 Cl                 1.84578500    0.28507800    0.00000000
 H                 -0.30677300   -0.27161000    0.87777800
 H                 -0.30677300   -0.27161000   -0.87777800
 F                 -2.85029100   -2.51104600    0.00000000
 C                 -0.51958200    1.71858400    0.00000000
 H                 -0.18959400    2.26610200   -0.88878200
 H                 -1.61550300    1.68053000    0.00000000
 H                 -0.18959400    2.26610200    0.88878200

B 1 5 S 35 -0.1
A 5 1 6 F
The format of the input file is similar. You request a constrained optimization by requesting the job type opt=modredundant. After the blank line below the XYZ coordinates, you have to specify your constraints, i.e. what parameters will be fixed or scanned.
To constrain:
B 1 2 F: freezes the bond length between atoms 1 and 2 (“B” for bond)
A 1 2 3 F: freezes the angle between atoms 1, 2 and 3 (“A” for angle)
D 1 2 3 4 F: freezes the dihedral angle between atoms 1, 2, 3 and 4 (Z) (“D” for dihedral)
N.B. Gaussview displays the atom numbers when clicking on them
To scan, write your constrain as: B x y S N s
“B”: bond (it could also be an angle or dihedral, you simply need to specify more atoms as needed)
“x y”: between atoms #x and #y
“S”: scan
“N”: number of steps for the scan
“s”: step size (in Å for bonds or degrees for angles)
In the above example, you can notice we scan a bond between atoms 1 and 5 for 35 steps of -0.1 Å. We also keep the angle between atoms 5, 1 and 6 fixed.
Once the scan is complete, the structure corresponding to a maximum of energy (and low gradient) should be very close from the actual TS for this system. This structure can then be submitted to a full TS optimization (as explained above).
For transition structure, then should have exactly one imaginary frequency to be considered true first-order saddle points.
Examples
As an example, let’s compare the SN2 and E2 reactions of chloroethane with fluoride.

Optimizing the reactants and products:
Reactants:
Chloroethane: (.com input file)
Fluoride: (.com input file)
SN2 Products:
Fluoroethane: (.com input file)
Chloride: (.com input file)
E2 Products:
Ethylene: (.com input file)
HF: (.com input file)
Chloride: (.com input file)
Optimizing transition structures:
TS for SN2: (.com input file)
TS for E2: (.com input file)
For each structure, the input file is provided, so you get to see examples of each type. In case you did not have good guesses for the transition states, you would want to locate them yourself.
Creating a guess structure:
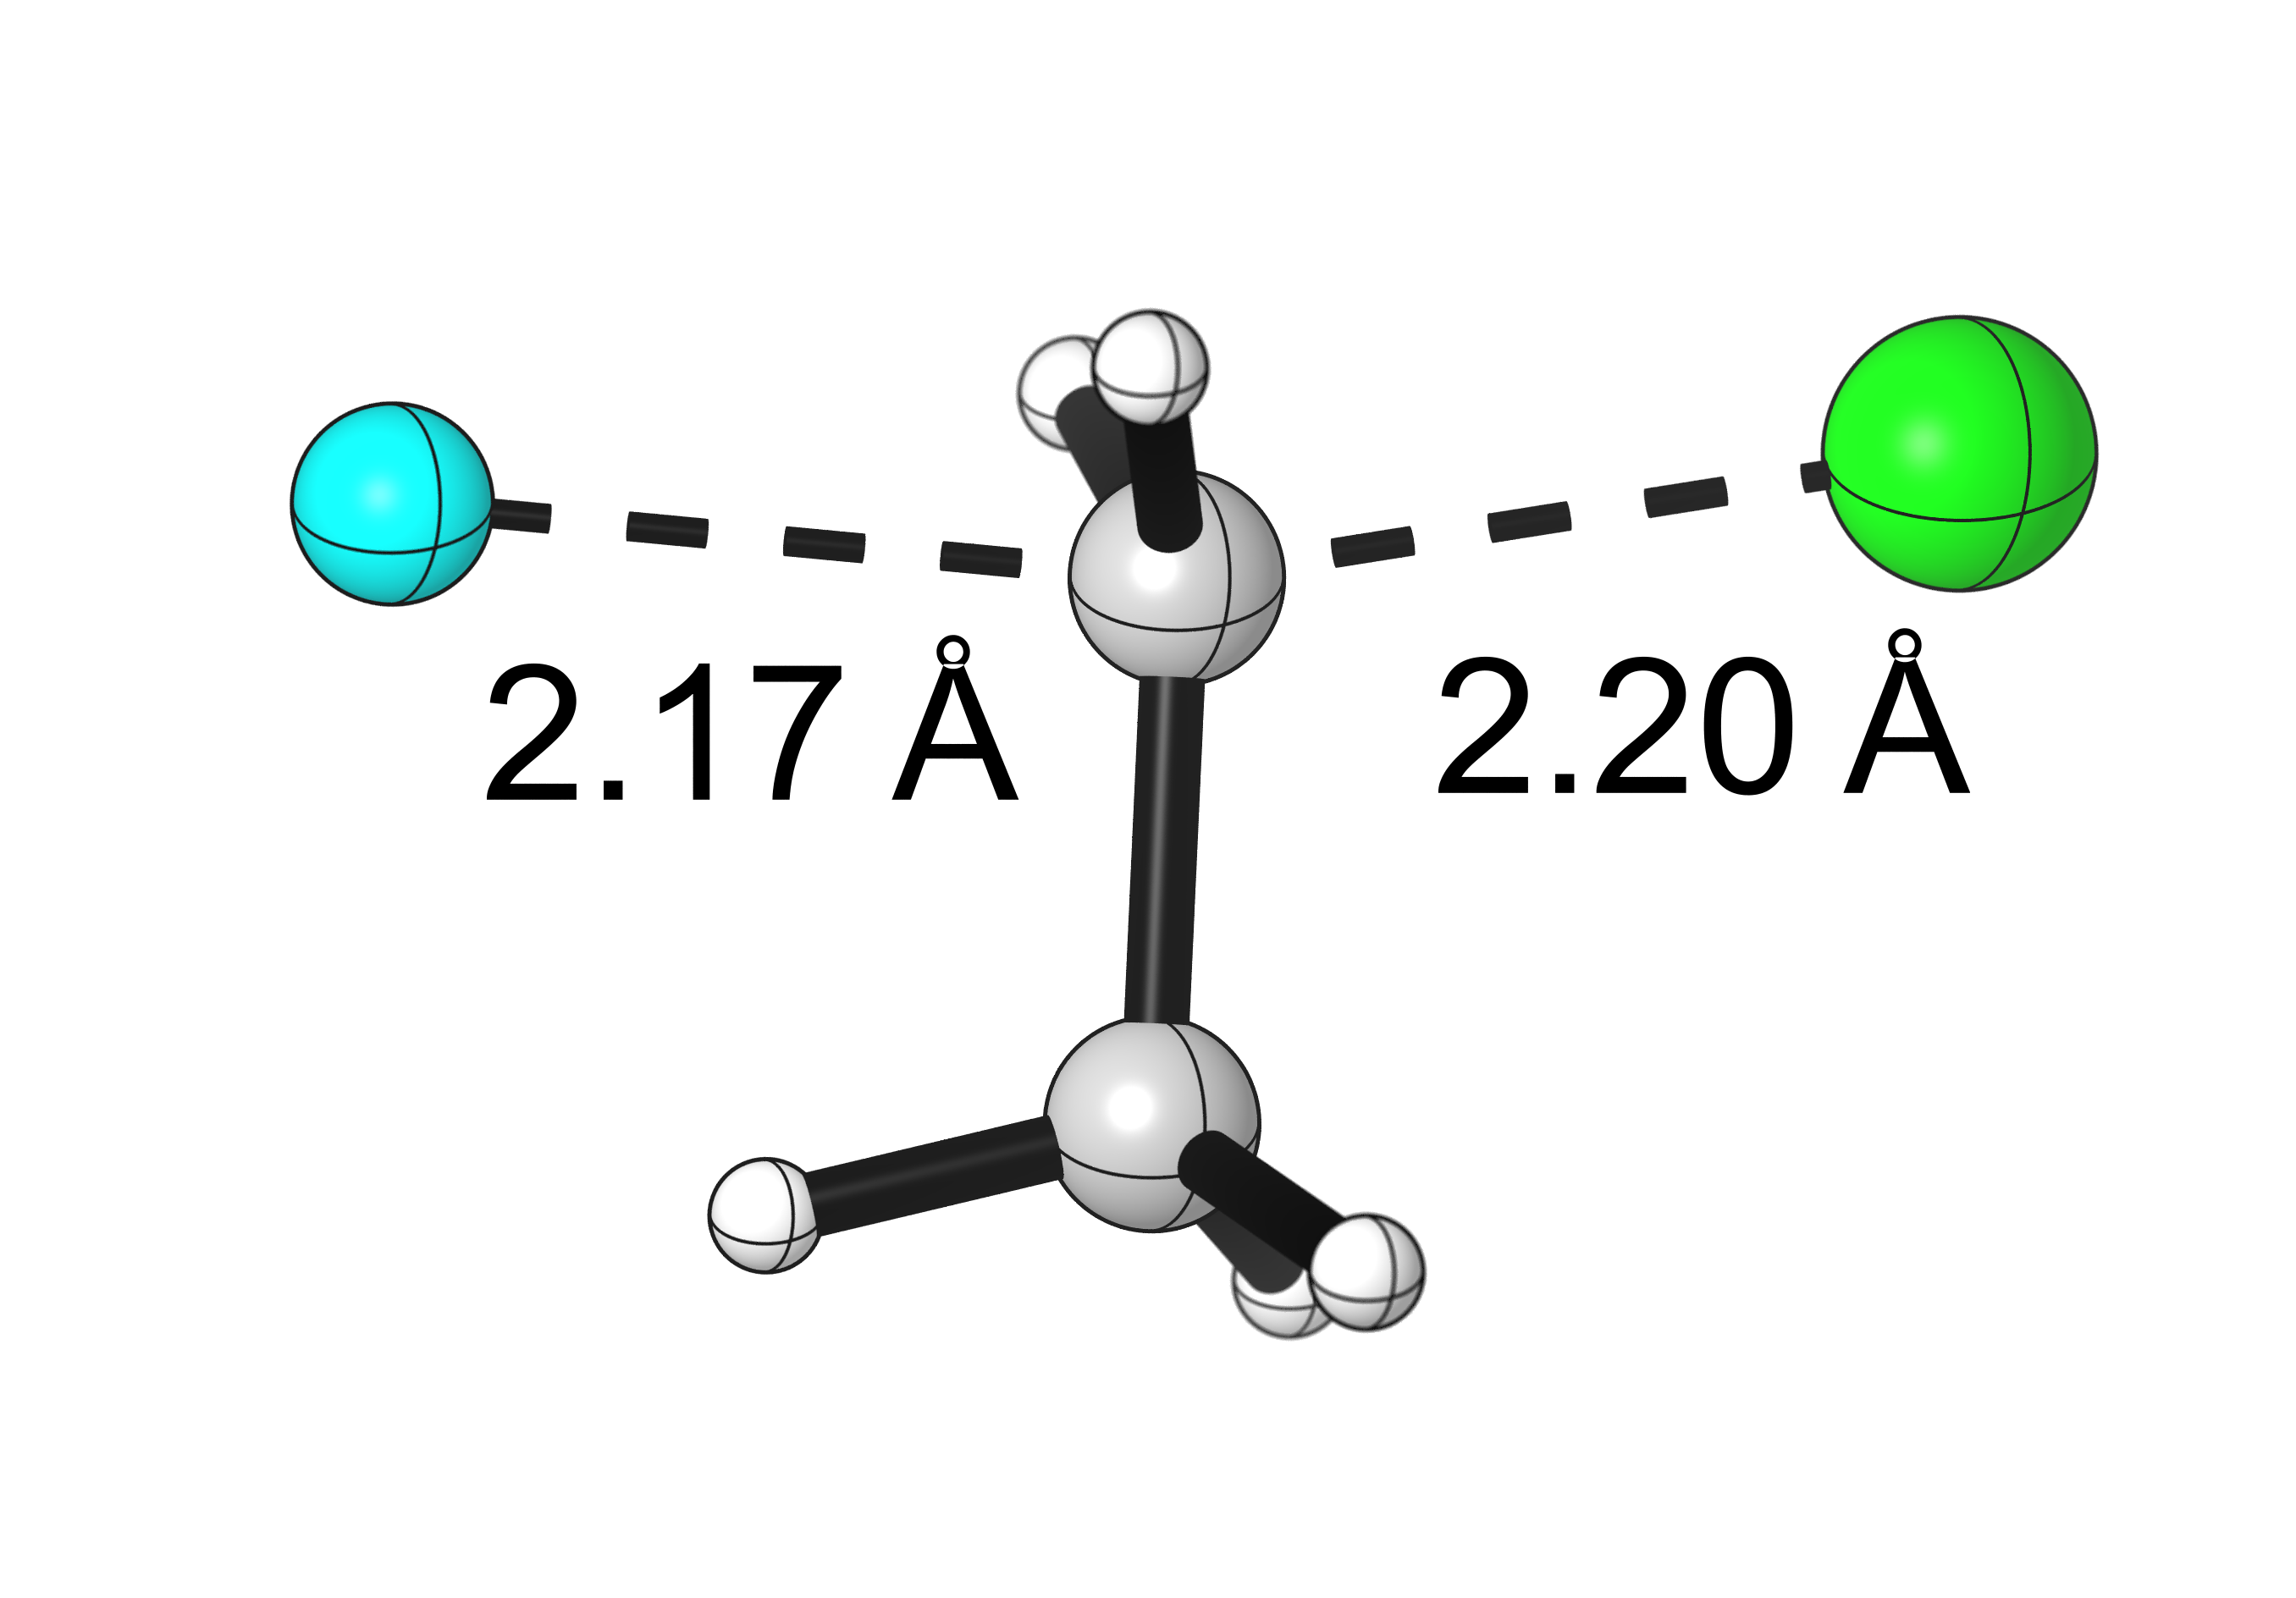
- Prepare a guess structure where both the breaking C-Cl bond and the forming F-C bond are 2.2 Å. Then, ask Gaussian to optimize by keeping those two bonds at this distance. This choice is arbitrary but most be informed by chemical intuition or similar structures.
- In this specific case, atom 1 is the carbon atom linked to the chloride in chloroethane, 2 is chlorine, 5 is fluorine.
- Two constraint lines at the end of the file are to freeze the C-Cl bond (B 1 2 F) and the C-F bond (B 1 5 F) at the value they have in the input file.
- After the optimization is finished, the final structure can be submitted to a full TS optimization.
Constrained optimization of an SN2 guess structure: (.com input file)
Generating a scan:
- The reaction coordinate of an SN2 reaction involves simultaneous bond breaking and bond forming. You have to choose one bond to scan, so let’s choose the F…C distance.
- Starting from the reactant complex, we will scan the bond between carbon 1 and fluorine 5 by increments of 0.1 Å.
- The input file also freezes the angle between fluorine, carbon and chlorine.
Scan along the SN2 reaction coordinate: (.com input file)
Results from the scan:
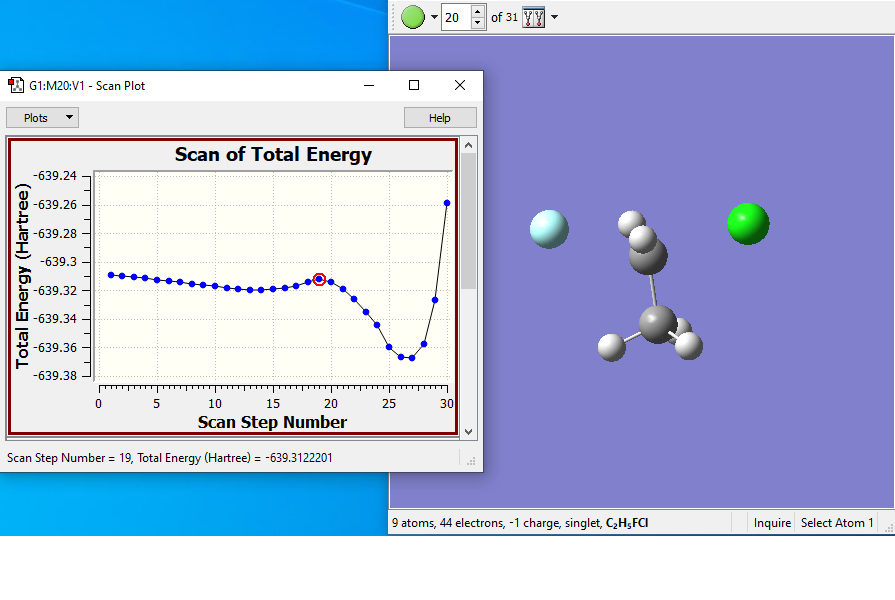
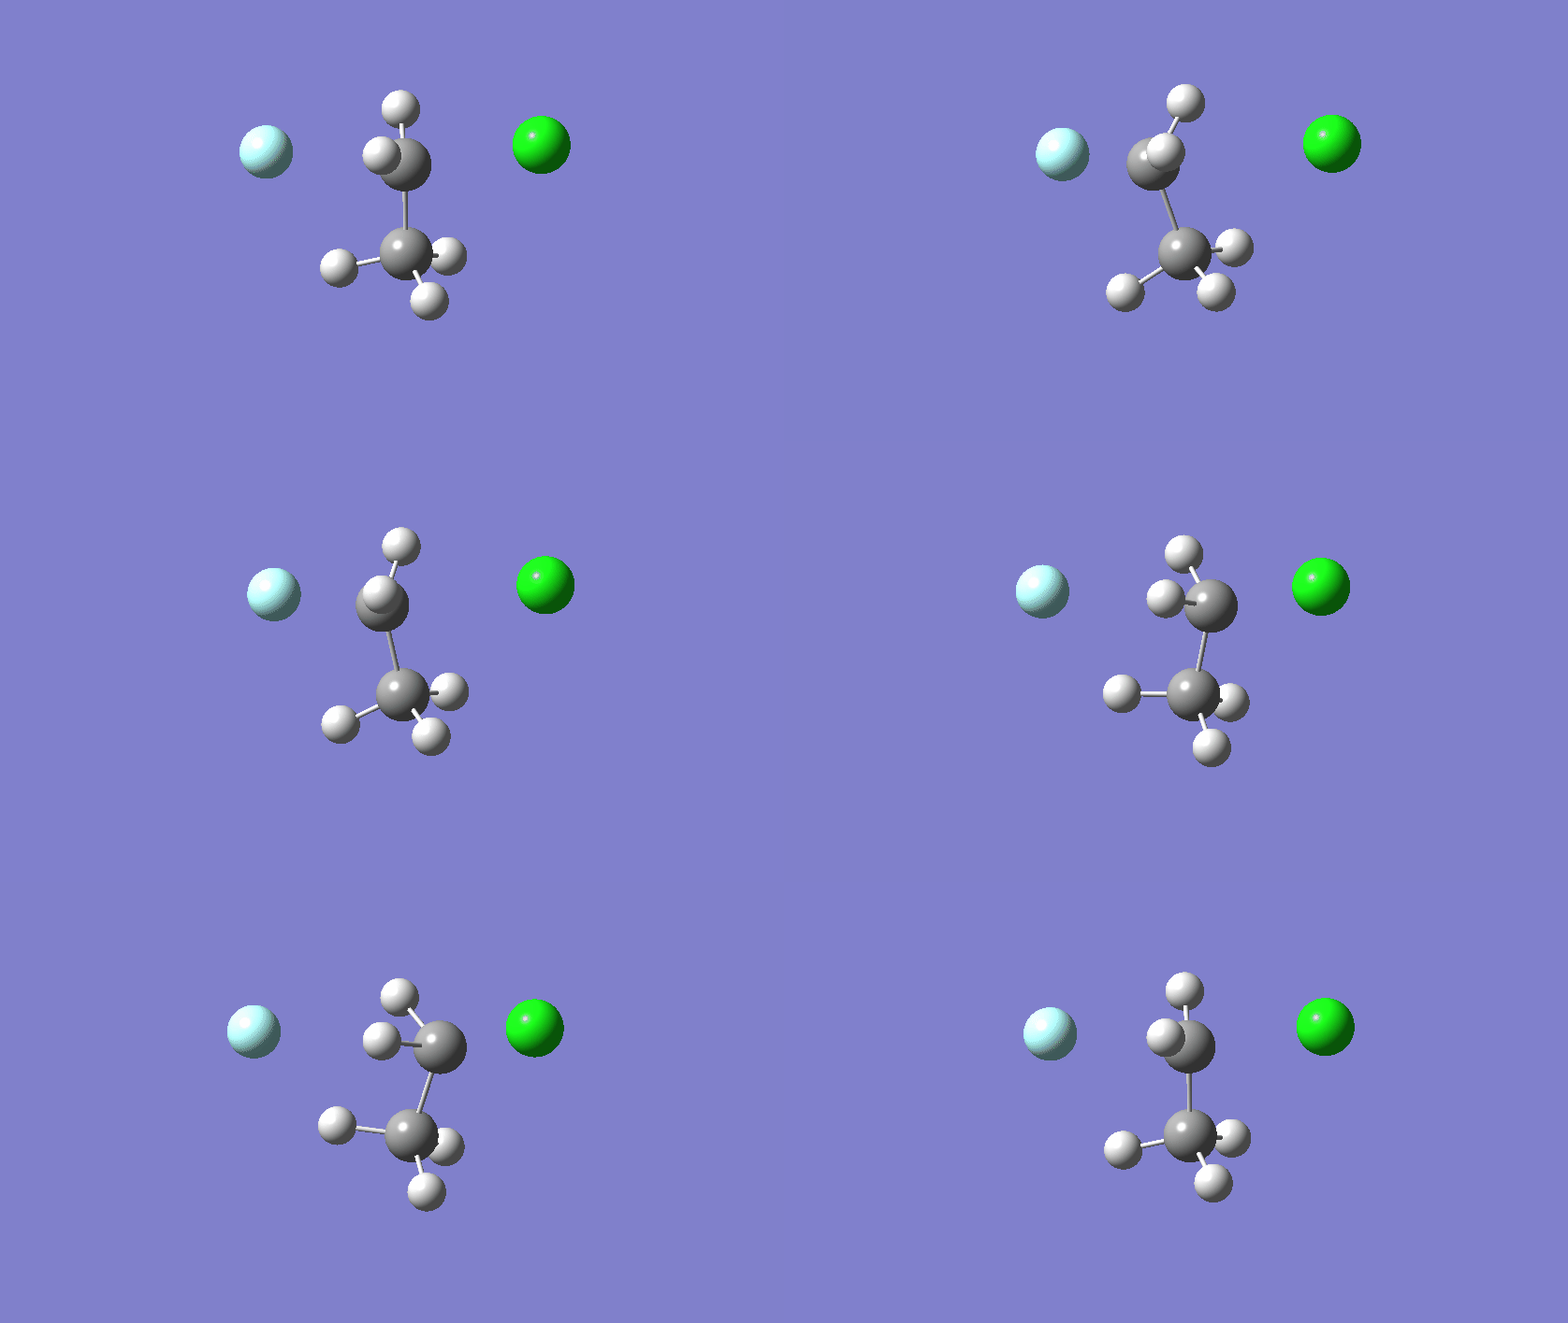
- The scan starts with the fluorine too far from the carbon, so the first points decrease the energy. Around point #12 is the reactant complex, and from there the energy rises to a TS at around point #19. The product complex is around point #27.
- Structure #19 is the guess structure for the TS, which will be submitted to a full optimization.
Final results:
Some Issues and Their Solutions
For TS optimizations:
If during a TS search the structure optimizes toward a local minimum, with an important decrease of the energy on the optimization graph, that means the starting structure for the TS search was too far from the actual TS geometry (and consequently too close from a minimum). The solution is to start from the submitted structure (first point) and modify the structure to make it further from the minimum. For example, if you optimize a TS for a bond formation, and the TS search breaks into a structure where the bond is formed, restart the optimization from the beginning with a longer distance between the two bond-forming atoms.
For any kind of optimization:
Often you get a Gaussian error called “convergence failure”. To navigate around those, two main solutions have worked for us:
- solution #1: from the lowest energy point, slightly modify the structure (change a angle or a bond length) and reoptimize.
- solution #2: from the lowest energy point, reoptimize the structure with a different SCF (self consistent field) method (keyword: SCF=option). Usually, SCF=QC is useful for difficult convergence cases.

Hi, I am trying to learn how to do these potential energy surface. Trying to get the transition state of a hydroxyl anion attacking a carbonyl carbon. Where then, a fluorine atom breaks off, by hydrolysis. (C7F14O + -OH) —> (C7F14O2H + -F).
Once the log file comes back. How can you tell is worked? The first number in the vibrational results is negative? Does that mean it worked?…..
Lastly, when you obtained the desired results. How do you plot the potential energy surface in 3- dimensions.
I look forward to your reply.
Thank you!
Hi David,
For the reaction that you describe, I expect two steps each with its own transition structure. Since both steps you describe involve only one bond forming/breaking, you can run scans to locate good TS guesses. After you’ve requested a TS search with frequencies, you can check the vibrations and the lowest one should be imaginary (negative). However, you need to double-check that its vibrational mode is along the reaction coordinate that you are looking for, in your case that the HO…C bond is forming, or that the C…F bond is breaking.
As for generating 3D potential energy surfaces, I’m not aware of how to generate them in Gaussian16. You can still generate “regular” 2D PESs using the energies you obtain for the various intermediate and TSs along your reaction pathway.
Hope that helps,
-PAC
Hi pier,
I managed to get an log output back today. The output says it was successful But, I want to make sure I did this correctly.
I focused on the CF2-CO-F part of the structure to scan with -OH as well; kept the C-C-F part frozen.
When I opened the log output file. The OH is connected to the molecule while the -F is disconnected.
I then opened the results- scan. I see that the scan of total energy shows a graph that looks like a morse potential.
My question is. Do I use the minimum of that graph to do a transition state or the last scan coordinate? Thank you and look forward to your reply.
-DQE
Also, I forgot to mention that I am using gaussian09 to do these TS states. Would the examples that are provided on this website be the same?
Best
DQE
Hi David,
In a scan output file, you should see a maximum along the reaction coordinate that you chose; that would be a good guess for a TS search procedure. If your scan did not do what you asked for (e.g. broke the C-F bond instead of the C-OH bond), that means the input file did not have the correct keywords or constraints.
Best of luck,
-PAC
Hello, great work, what do you use for the “cartoon” representations?
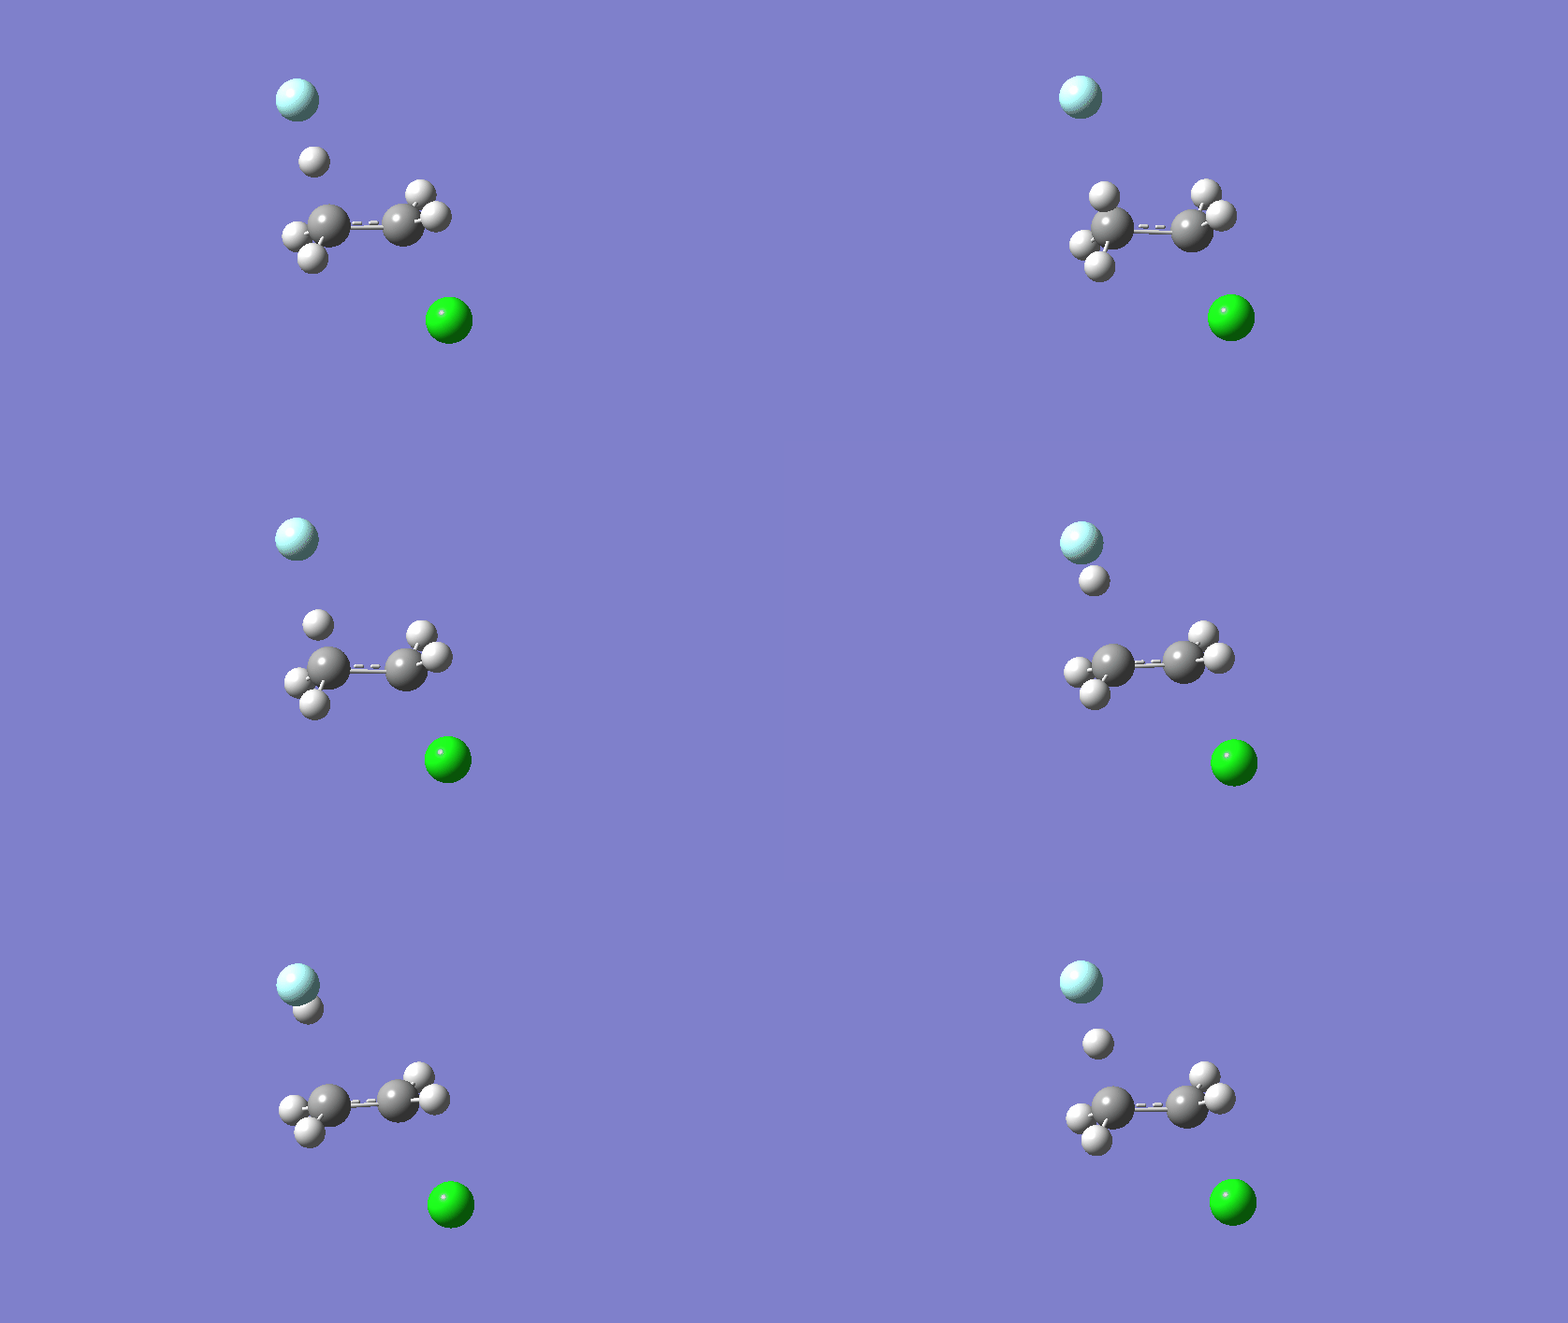
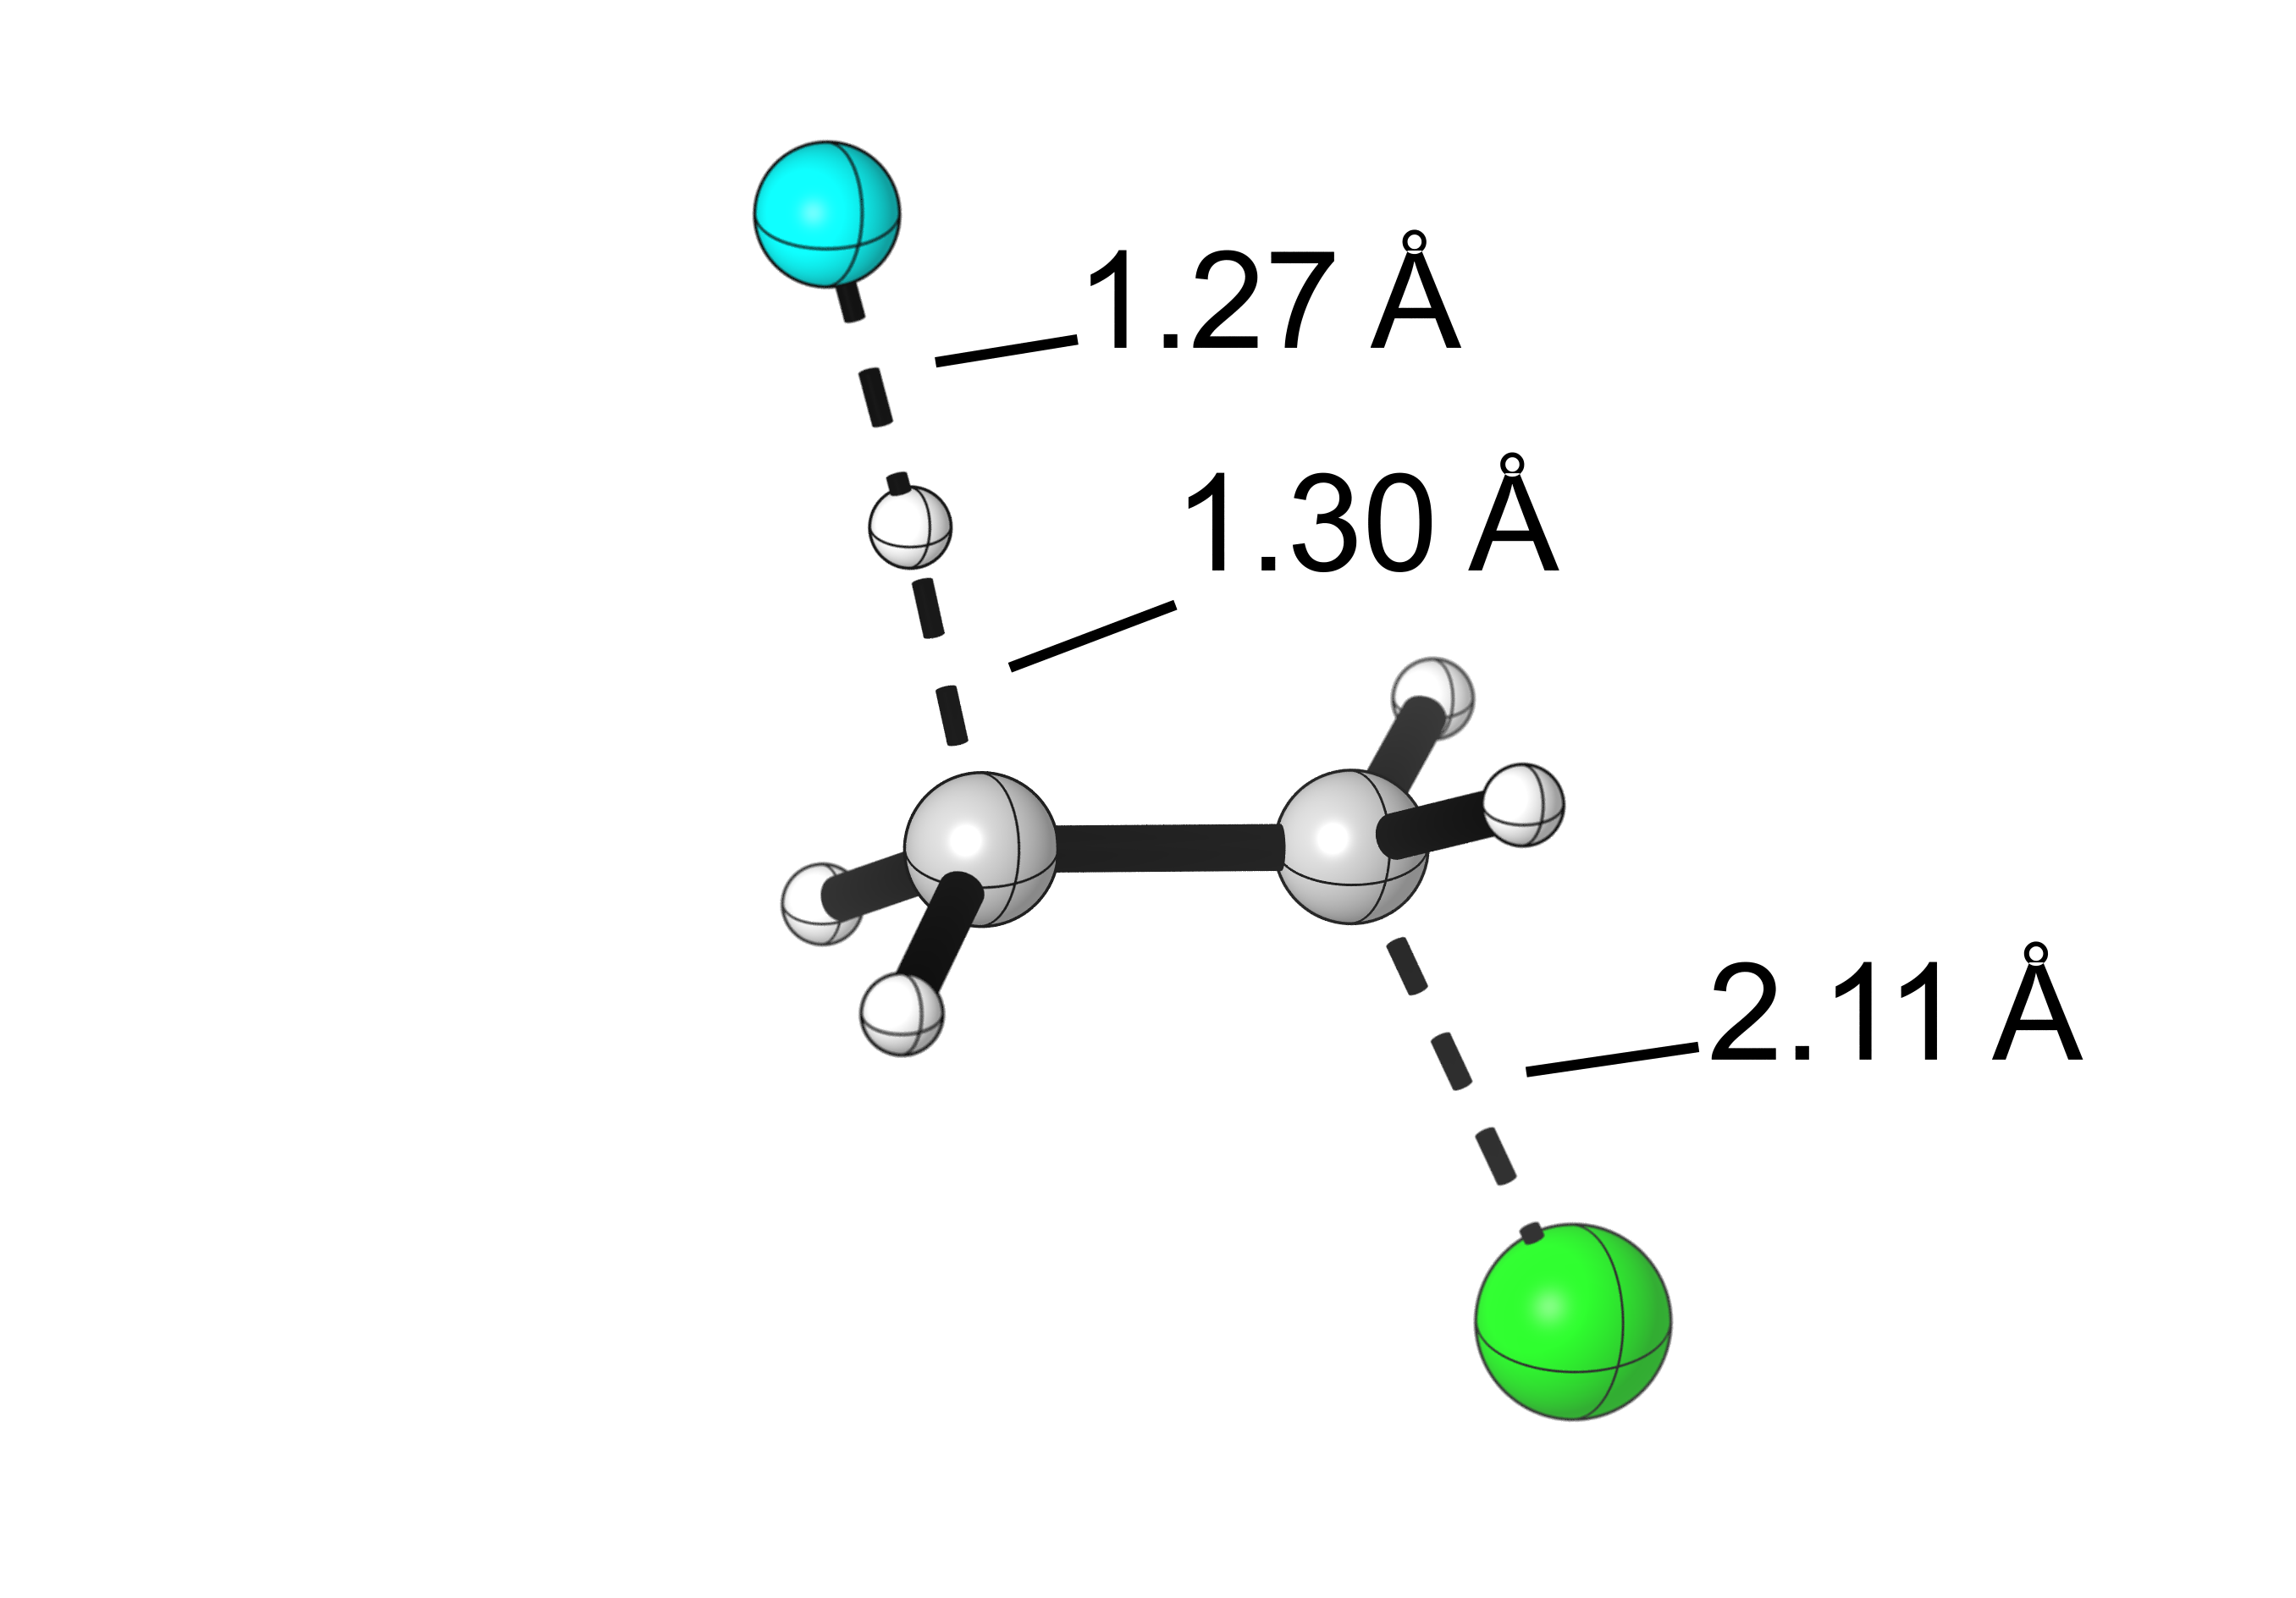
Such as in the image “Visualization of the bond lengths of the E2 TS” or in “Visualization of the bond lengths of the SN2 TS”. Thank you.
Hi Alvaro, we use CYLView (https://www.cylview.org/) to generate our publication-ready visualizations of computed structures.
Hello, I am a second year Ph.D student currently working on organic computational chemistry.
I have one question regarding PES scanning, do I need to freeze any bond parameter during scanning like in oxidative addition and reductive elimination step?
Hi Poulami, you ask a great question.
When scanning, you don’t need to freeze any bonds. The coordinate you are scanning (e.g. a bond length) is considered frozen by Gaussian and is changed gradually, giving you the final scan. Sometimes, when a scan activates a coordinate you did not want to change, then it can be helpful to add a constraint in addition to requesting the scan. In that case, remember to freeze the coordinate first in your input file, then add the scan parameters.